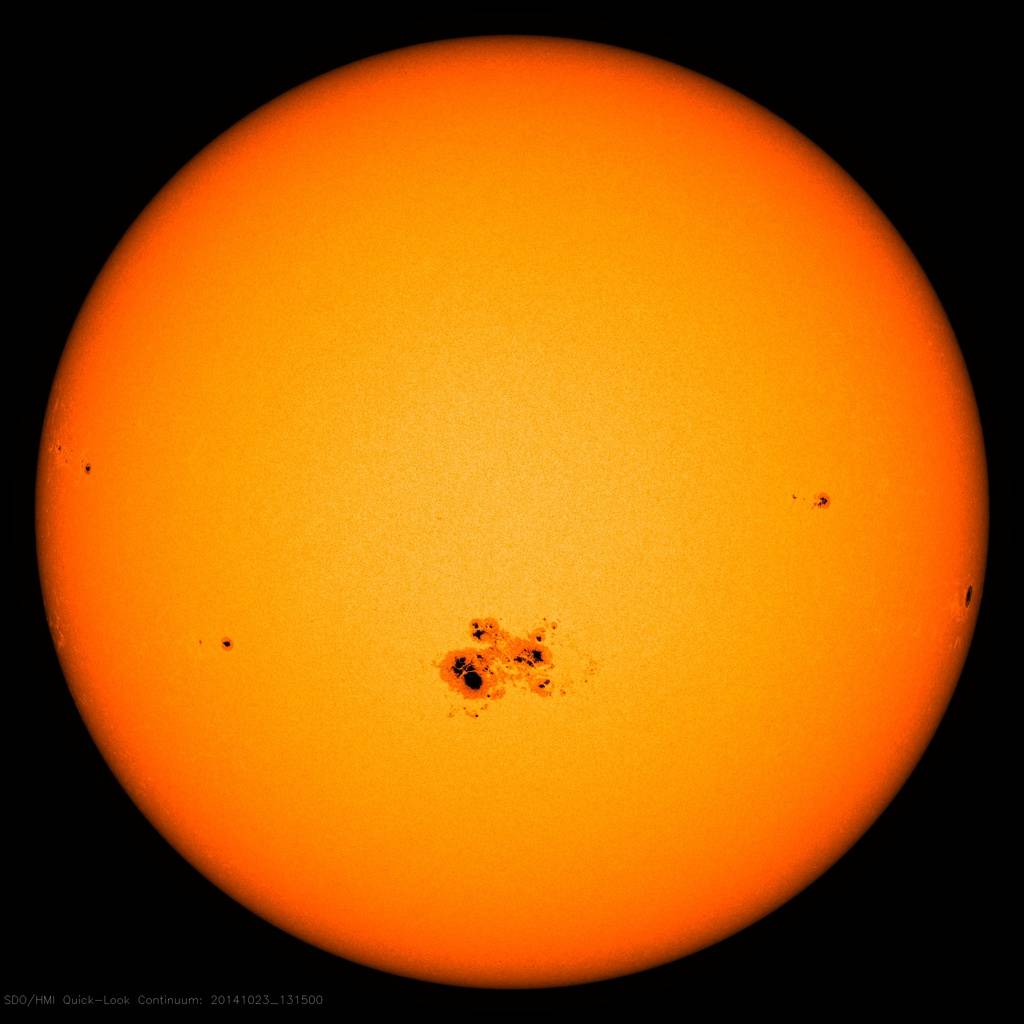
Après l’intensité de la lumière les taches solaires sont la caractéristique la plus évidente de la photosphère solaire. Les registres des taches solaires remontent loin, mais ce n’est qu’ après l’invention du télescope que nous avons réussi à les observer en détail. Leur taille varie selon leur position sur le Soleil; leur position varie; et leur nombre et fréquence varient selon une certaine periodicité (11 ans).
Le Soleil avec un grand groupe de taches solaires 23 octobre 2014
Un grand groupe de taches solaires photographié par L'Observatoire de la dynamique solaire. Le diamètre du groupe au centre de l’image est environ 130 000km (10 fois le diamètre de la Terre)
Les taches solaires sont sombres en comparaison avec la photosphère; elles correspondent à des régions plus froides de la surface solaire à cause de la présence d’un champ magétique intense qui perturbe le flux d’énergie (chaleur)
December 2001 (Trace Satellite)
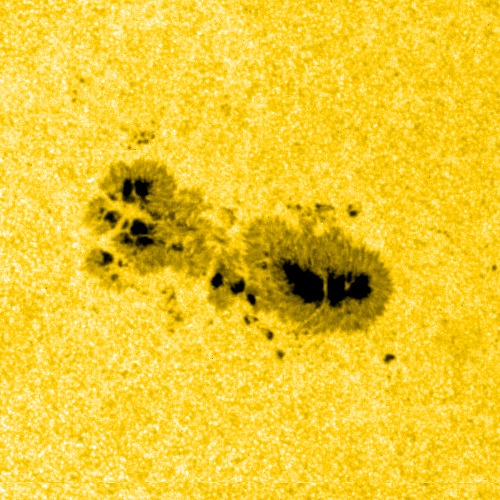
As can be seen from the images above, large sunspots occur in pairs. They begin as small pores and develop rapidly, with a large group generally having developed to its full potential and comprising of a pair of individual large spots after about a week. Sunspots are highly irregular in size, shape and form although the ‘basic’ pattern remains the same.
The persistence i.e. the lifetime and longevity of sunspots vary, depends upon size. Swiss astronomer Max Waldmeier (b.1912 d.2000) derived an empirical approximation linking the longevity of a sunspot to its maximum area:
t~= A(max)
where t is the sunspot group lifetime in days and A(max) is the maximum area of the group in millionths (…of the sun’s apparent surface area). This is sometimes referred to as the Gnevyshev-Waldmeier rule and is an approximation appropriate for small to moderate sized sunspot groups.
Persistence varies from a few days to no more than 100 days. Fifty percent of all sunspot groups have lifetimes of less than two days and 95% of groups have lifetimes of 15 days or less. During this lifetime, the spot group changes in form; it fragments, disperses and the individual components reduce in size to become no longer visible.
Sunspots are magnetically active regions; their strength observable using magnetographs. Within the structure of a typical sunspot group, the umbra of each large spot is the centre, or footing, of the magnetic field flux ‘tube’ and one can picture the field strength to follow an arc if the shape of an Ω. The field direction in the central parts of umbrae is near to the vertical, and umbral field strengths vary ~ 2,000 to 3,500 Gauss (with the larger values associated with large sunspots). Penumbral magnetic field strengths typically are 2,000 to 2,500 G at the penumbral / umbra boundary, and 500 to 1,000 G at the penumbral / quiet photosphere boundary.
The leading spot (i.e. the spot on the eastern side of the pair) is usually the larger and the magnetic polarity of the two distinct large spots is a dipole, North/South. Polarities of the pair are always the same in the same solar hemisphere; i.e. if a northern hemisphere sunspot has polarity orientation of ‘leading North, trailing South’, then all sunspots in the Northern hemisphere will have the same polarity orientation. Meanwhile, in the Southern solar hemisphere, any sunspot group will have the reversed leading/trailing polarities. This polarity is consistent throughout an entire solar cycle (~11-year period). However, in the subsequent solar cycle, the polarities per hemisphere will be reversed.
Spectroscopic based measurements (Wien and Planck distribution peaks) allow astronomers to measure the temperature of the constituent parts of sunspots. The radiative heat flux (which we can equate to ‘brightness’) of the umbra is generally 20% that of the undisturbed photosphere, with the penumbra emitting around 75% that of the photosphere. Although the umbra looks very dark in comparison to the photosphere, in isolation it would still be immensely bright (to the human eye). Typical temperatures range from 3,500 up to 5,000 Kelvin for the umbra, with the larger spots having the lower umbral temperature within this range. The penumbral temperature range is typically 5,000 to 5,500 Kelvin with a temperature gradient which rises towards the undisturbed photosphere.
In 1909, whilst working at the Kodaikanal Observatory in Southern India, the British astronomer John Evershed (b.1862 d.1956) demonstrated material flow, radial motion, within the fine filaments of the penumbra. This motion, known as Evershed flow, was detected using Doppler techniques. The flows have the characteristic of outward flow along the penumbral filaments towards the photosphere (typical horizontal velocities of 1 to 2 km s-1) and an inward flow from the inner penumbra towards the umbra (typical horizontal velocities of 0.5 to 1 km s-1).
Recent 3-dimensional models have shown that this effect can be explained by thermal convection, with the upper photosphere and sunspot interacting within the very strong magnetic fields. This can also explain the fine filament structure of the Penumbra. The interested reader is highly recommended to read reference [3]. The reduced temperature of sunspots is now considered to be heavily driven by the magnetic field disrupting the convection processes with the photosphere / granulation.
[1] The Sun – Shining light on the solar system
Neil Taylor. Observatoire Solaire 2017
https://www.observatoiresolaire.eu/solar-physics.html
[2] Natures Third Cycle
Arnab Rai Choudhari. Oxford University Press. 2015
https://global.oup.com/academic/product/natures-third-cycle-9780199674756?cc=fr&lang=en&
[3] Convection and the Origin of Evershed Flows
A Nordlund and G B Scharmer
Astrophysics and Space Science Proceedings, Springer-Verlag,
Heidelberg, Berlin, 2009
http://arxiv.org/pdf/0905.0918v1.pdf


